Running a multi-vendor smart metering estate: an operating model

Executive summary
Most utilities did not set out to run a multi-vendor smart metering estate. It happened gradually: a first rollout with one meter supplier, a second tender won by another, a gas or water programme with its own head-end, and a network mix of PLC, RF mesh and cellular that grew with each phase.
The result is an estate that works, but is hard to operate. Visibility is split across vendor consoles, exceptions are triaged by hand and field visits are used to answer questions that the data could have answered remotely.
This paper sets out a practical operating model for a Smart Metering Operations Centre (SMOC). It covers the people, process, data and KPIs needed to run a mixed estate as one, and a staged path to get there that delivers measurable value at every step.
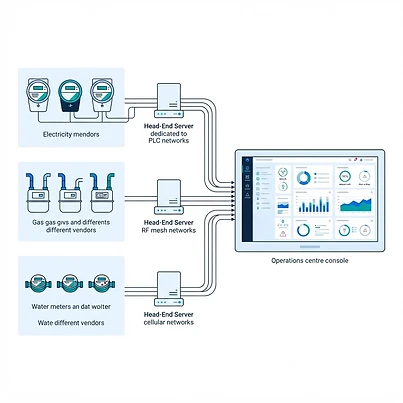
1. Why multi-vendor estates are hard to run
Each head-end system was designed to manage its own meters well. None of them was designed to manage the whole estate. That gap shows up in four ways.
- Fragmented visibility: read rates, alarms and firmware status live in separate consoles, each with its own definitions
- Slow root cause analysis: a network fault that affects meters from two vendors looks like two unrelated problems
- Field-first habits: when diagnosis is hard, the default answer is to send an engineer
- Weak evidence: SLA and regulatory reporting is assembled by hand, often weeks after the fact
The cost is not only operational. When nobody can say with confidence why 3% of meters failed to read last night, it becomes hard to hold vendors to account, hard to plan investment and hard to defend the programme in budget review.
2. The four pillars of the operating model

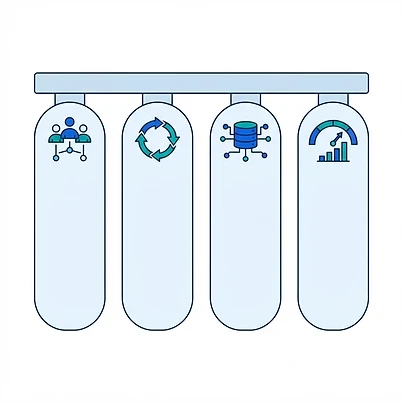
Pillar 1: People
One operations team owns estate health end to end, regardless of vendor. Typical roles include:
- Estate analysts who monitor read performance and network health across every head-end
- Remote resolution specialists who run diagnostics, reconfiguration and firmware actions
- Field coordinators who turn confirmed faults into well-scoped work orders
- A security and change lead who approves high-impact commands and key operations
The key shift is ownership. Vendors remain responsible for their products, but the utility owns the outcome.
Pillar 2: Process
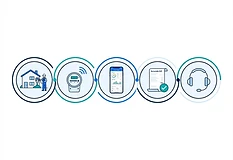
Every exception follows the same path, whatever the meter or network:

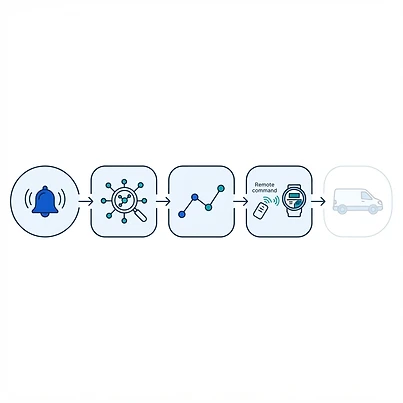
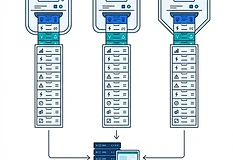
- Detect: alarms and missed reads arrive in one normalised queue
- Diagnose: automated checks classify the likely cause, such as meter, communications module, network or head-end
- Correlate: related events are grouped so a single network fault is handled once, not hundreds of times
- Resolve remotely: reconfigure, re-key, re-read or update firmware where possible
- Dispatch: only confirmed on-site faults become work orders, with the diagnosis attached
Pillar 3: Data
The model depends on a vendor-neutral information model. Events, readings and asset data from each head-end are mapped into common definitions based on standards such as DLMS/COSEM and IEC CIM. Without this, every report is a reconciliation exercise.
If two systems disagree on what a failed read is, you cannot improve the read rate. You can only argue about it.
Pillar 4: KPIs
A small set of shared KPIs keeps the operations centre honest:
- Read rate by vendor, network and region
- Mean time to resolve exceptions
- First-time fix rate for field visits
- Avoided truck rolls resolved remotely
- SLA evidence produced automatically for vendors and regulators
3. What changes when the model is in place
The most visible change is in field work. When diagnosis happens before dispatch, a large share of visits disappear, and the ones that remain are more likely to succeed first time.
- Before
- With operating model
Read performance also improves steadily, because recurring causes are fixed at source rather than worked around meter by meter.
4. A staged path to get there
The model does not need a big-bang programme. Each stage stands on its own and pays for the next.

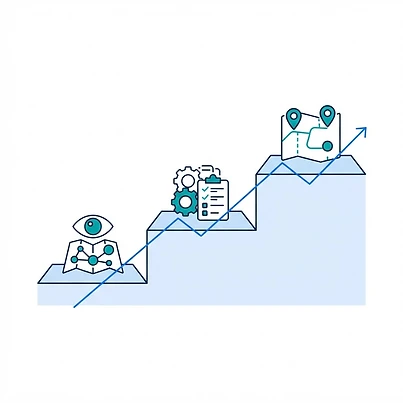
Stage 1: Visibility (months 0 to 3)
Connect every head-end into one view. Normalise read and alarm data, and publish a single estate-wide read rate. Many utilities find their first quick wins here, simply by seeing clusters of failures they could not see before.
Stage 2: Automated triage (months 3 to 9)
Introduce rules and correlation that classify exceptions automatically and group related events. Remote resolution becomes the default path, and operators spend their time on causes rather than symptoms.
Stage 3: Field optimisation (months 9 onwards)
Feed confirmed diagnoses into work management, track first-time fix and use the data to plan targeted replacement and network improvements.
5. Governance and security
Running the estate centrally increases the importance of control. The operating model includes:
- Role-based access so each team sees and does only what it needs
- Approval for high-impact commands such as disconnects, valve operations and mass firmware updates
- Key lifecycle tracking with a full record of who used which key and when
- An immutable audit trail that supports regulatory and vendor reviews
See our security approach for more detail.
6. Common pitfalls
- Starting with automation before visibility. Rules built on inconsistent data automate the wrong thing.
- Treating it as an IT project. The operating model is about ownership and process first; technology supports it.
- Measuring too much. Five shared KPIs that everyone trusts beat fifty that nobody reads.
- Leaving vendors out. Share the data. Vendors improve faster when they can see the same evidence you do.
Conclusion
A multi-vendor estate is not a problem to be solved by consolidating suppliers. It is an operating challenge that can be solved by running the estate as one: one team, one process, one data model and one set of KPIs. Start with visibility, automate triage, then optimise field work, and measure the value at every step.
To see how this would look on your own estate, use the ROI calculator or request a demo.
Figures marked illustrative are indicative examples and not results from a specific customer.
How smoc.cloud helps
Moving from vendor consoles to an operations centre needs a platform built around operations, not around a single vendor. smoc.cloud provides the shared tooling the operating model relies on.
- Spot it
One view for every team
Operations, network, field and security teams work from the same live estate data across all vendors, with role-based views for each.
- Find the root cause
Shared root-cause analysis
Correlated incidents with clear evidence give teams a common understanding of what failed and why, which ends the hand-offs between vendor consoles.
- Fix it
KPIs that drive improvement
Built-in SLAs, workflows and KPI reporting turn the operating model into daily practice and show where processes need to change.
Start with estate-wide read-rate visibility across every head-end, then move to automated triage. DNOs typically see the biggest early return from avoided truck rolls.
DNOs: how smoc.cloud helpsOne email a month with new articles, whitepapers and field notes on running smart metering estates. Unsubscribe at any time.